
Method Guidelines
Digital Ecosystem Analysis
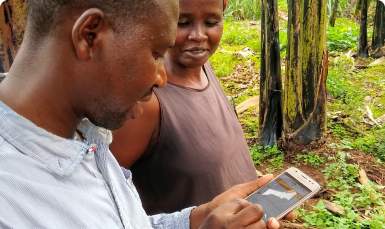
Check the environment of your innovation. Discover systematic barriers for the usage of your product, and identify opportunities for synergies with existing services
Image by Storyset from Freepik
Phases of Analysis
![]()
Time: 2-3 days
Planning
- Defining the scope and priorities for the analysis
- Scoping of existing data
- Planning for collection of additional data
![]()
Time: 1 week
Analyze & Report
- Analyze data and create visualizations
![]()
Time: 1-2 days
Operationalize & Socialize Results
- Interpret data and discuss implications with team
- Decide on measures to address issues identified in data
Planning
2-3 days
- Defining the scope and priorities for the analysis
- Scoping of existing data
- Planning for collection of additional data
Analyze & Report
1 week
- Analyze data and create visualizations
Operationalize & Socialize Results
1-2 days
- Interpret data and discuss implications with team
- Decide on measures to address issues identified in data
USAID’s Digital Ecosystem Framework
There is not one valid definition of digital ecosystems, but many.
The Theory
USAID has developed a very comprehensive vision of digital ecosystems together with an extensive framework guiding its analysis. The USAID Digital Ecosystem Framework is organized around three separate, overlapping pillars:
- Digital Infrastructure and Adoption
- Digital Society, Rights, and Governance
- Digital Economy
It also encompasses four cross-cutting topics:
- Inclusion
- Cybersecurity
- emerging technologies
- geopolitical positioning
Disclaimer:
The content of this site is described based on the USAID framework. It is the authors’ own interpretation and does not represent any work validated or sponsored by USAID.
For your User Research, we suggest to focus on a few selected indicators within these pillars.
As part of your User Research regarding innovation development for food, land and water systems, we recommend an analysis of selected aspects of the three pillars of the digital ecosystem framework developed by USAID
Be aware that national data might not properly display the situation of rural target groups. Collecting disaggregated data that is specific of your target group will increase the informative value of your ecosystem analysis immensely.
Relevant criteria for your Digital Ecosystem Analysis

Framework source: United States Agency for International Development. (2022). Digital Ecosystem Framework. USAID.
Data Research
For most of them, we can suggest online sources below, for some you will have to reach out to the local stakeholder network to get recent analysis results.
Digital Infrastructure and Adoption
Indicators for Connectivity & Infrastructure
Connectivity & infrastructure comprises the essential elements that support data, devices (e.g., mobile phones), and internet services. Choices made by governments and the private sector regarding this infrastructure have a direct impact on digital service providers, internet usage, and access to digital tools and services.
Here is a list of questions you should ask when analyzing connectivity and infrastructure for your digital innovation. Check out the indicators we suggest as well as links to sources below.
Who is the main operator – whose network will matter for connectivity?
Check Mobile Network Operator (MNO) market share .
Do people use cell phones in your target region?
Assess number of mobile connections in your target region .
Are there prospects for change regarding your target group's connectivity?
Check for existing public-private partnerships for connectivity , or whether there are (ongoing) innovations around community networks, radio, or WiFi relays . Also look out for private or public sector investments in advancing connectivity (e.g., Microsoft AirBand/ National Broadband Plan etc.).
Do people own cell phones in your target region?
Use local data from your research region to assess the number of mobile subscribers in your target region.
Can your target group use electronic devices reliably?
Assess infrastructure (e.g. electricity connectivity in rural areas) .
Is the necessary backend infrastructure available to suppport your data management?
Use local data from your research region to find out about infrastructure. In specific cases: Emerging technologies to handle large data volumes are neccessary (cloud computing, AI, etc.) .
How well connected is your target group? What kind of services will be easy for them to use?
E.g. handling most Apps with anything lower than 3G is very tiring..
Study 2G, 3G, 4G (5G) network coverage maps and assess rural connectivity in geographical diverse countries. The following sources will help you:
Indicators for Security & Interoperability
Connectivity & infrastructure comprises the essential elements that support data, devices (e.g., mobile phones), and internet services. Choices made by governments and the private sector regarding this infrastructure have a direct impact on digital service providers, internet usage, and access to digital tools and services.
Who are the major stakeholders and what digital systems do they rely on?
Use local data from your research region to map major stakeholders in ICT market (Internet Service Providers, Mobile Network Operators, community networks, consumer organizations, existing digital innovations in your area)
What security measures are in place that matter to your innovation?
Indicators for Affordability
Affordability measures the relative cost of connectivity, necessary end user devices, their maintenance, and data expenses, which can deter widespread mobile and internet usage.
Can people actually afford the costs of your innovation?
Device purchase and maintenance costs (especially in cases where they’re hindering/affecting use of digital devices by marginalized or vulnerable populations)
Assess affordability for connectivity (price of 1GB as a percentage of average income: target = 2%)
Assess the relation of pre-paid versus post-paid accounts.
Use local data from your research region and read more here:
Gender Gap Report 2020
GSMA Mobile Disability Gap Report
A4AI Affordability Data Report
Indicators for Digital Literacy & Digital Divides
Digital literacy and the digital divide are two pivotal aspects of the digital landscape that significantly impact the uptake and use of your innovation. Digital literacy encompasses the skills required to navigate the digital world safely and effectively, while the digital divide highlights the disparities in access to digital resources and services.
Which subgroups of your target group have special needs to understand and use digital interfaces?
Assess the following dimensions and media use habits:
- Smartphone versus feature/basic phone penetration for different economic classes
- Cultural barriers & social norms and their influence on access
- Digital tools and services for disabled persons (for hard of hearing, blind, speech impediments, or other learning, developmental, and psychosocial disabilities)
- Digital tools and services for harder-to-reach populations (e.g., illiterate or linguistic minorities)
The following sources can help:
GSMA Mobile Disability Gap Report
ITU Internet Usage Statistics
After Access Survey Research ICT Africa
Global Gap Report 2022
What is your target group's competency in using digital interfaces?
a) Functional – being able to use tools
b) Systemic - understanding cyber threats and ability to protect personal data
Assess digital literacy using local data from your research region and using the source below as a point of reference:
What is your target group's ability to understand digital interfaces?
Assess digital literacy using local data from your research region and using the sources below as a point of reference:
What are commonly used media platforms in your target region?
Check top apps/ sites per country .
Digital Society, Rights, and Governance
The second section examines the intricate relationship between digital technology and government, civil society, and the media. It comprises many subsections, and we recommend to focus on data governance relating to the topic of your innovation.
Indicators for Data Governance Structures
Data governance entails the formulation and implementation of principles, norms, rules, and decision-making procedures that influence the evolution and use of digital services and their environment. Internet governance encompasses numerous public policy facets, including trade, civil liberties, cybersecurity, and sovereignty. It influences how people and businesses access online resources, including government use of the internet for internal processes and citizen services that you might aim to address, e.g. in supporting digital extension services.
What are local authorities' priorities with regard to digital development and ICTs?
Find out about national IT strategies to assess priorities of digitizing existing data sets
What relevant open data is available to feed your innovation?
Browse thematic open data portals to evaluat:
- Does it exist? Is it disaggregated? Is it timely?
- Barriers to using open government data
What relevant data is locally available to feed your innovation?
Browse national data portals to evaluate the following:
- Do they exist? Is the data disaggregated? Is it timely?
- Use cases (businesses, government service agencies, banks)
- Cost of accessing government data
- Interoperability of data between government ministries/ public information architecture
- In which format is government data is available in (e.g., Excel, PDF)?
Digital Economy
The third section delves into how digital technology enhances economic opportunities, trade, competitiveness, and global integration. It evaluates the prospects and obstacles associated with adopting digital financial services, e-commerce, and digital trade. Additionally, it scrutinizes the local digital talent pool and the tech startup landscape for strengths and weaknesses. This might be crucial for you to evaluate important partnerships, and ways to engage with existing, locally sourced solutions.
Indicators for Tech StartUp Analysis
The tech startup environment is an indicator of technological advancement in a country. Tech startups include both social enterprises and profit-oriented businesses focused on business services, transportation, or even gaming. In many developing countries, digital startups cater to an international market rather than aiming for local adoption. A promising startup environment can attract foreign investment, incentivize skilled IT professionals to remain in-country, and encourage innovation.
Which tech startup do exist in your region and what's their focus?
Use local data from your research region to evaluate the density of startups in the region.
This source might be helpful:
Which sectors are emerging sectors for startups in your target region?
Use local data from your research region to evaluate sectoral focus of tech startups in the region.
Who are competitors in your field?
Use local data from your research region to conduct a SWOT analysis of weaknesses and strengths of the existing innovations in your field.
What kind of finance and public incentive infrastructure exist to support the growth of an innovation ecosystem?
Use local data from your research region and the source below to assess the following:
- Innovation hubs and accelerators
- Investor landscape (existence of angel investor networks, foreign investors)
- Existing Incentives/quotas for tech entrepreneurs/specialists who are from marginalized or vulnerable populations in public policies
Data Interpretation
Building Hypotheses to Prepare an Experience Map:
To feed the data you collected into your design processes, use an Experience Map or User Journey to visualize the different steps in the projected usage of your innovation:
- Map the related ecosystem factors – e.g., all factors related to connectivity and infrastructure will affect step 1 in your users’ interaction with your service or product – downloading or registering for your service or opening your message.
- Discuss within your team how the results of your ecosystem analysis affect each step, and
- Discuss which design measures you could take to take them into account.
For a more detailed approach to using User Research Data in your design processes, please see the module Operationalizing & Socializing Research Results.
Measures you decide to take based on the Digital Ecosystem Analysis might be, e.g.:

Form Partnerships
Forming partnerships to improve the service environment and/or infrastructure that will allow your users to use your product or service
Review Technology Fit
Discussing the fit of the technology for your target group might entail redesign or a combination with widely used technologies to lower access barriers.
Build Capacities
Offering capacity building measures to enable your target group to gain the necessary skills to use your product safely.
Best Practices

Digital Ecosystem Analysis in Guatemala
Do’s and Don’ts
Do’s
- Scrutinize the source and the used data collection/analysis method
- Check validity and scope of the data you use (Localized data beats national data)
- Before you start your Digital Ecosystem Analysis, work with a User Journey, even if still very basic, to list interfaces, bottlenecks and necessary conditions for your product to deliver a valuable experience. Define a list of criteria and indicator that can talk best about whether these exist in your target region and for your target users
- Be sure to provide an interpretation of the data to your team, summarize what the indicators might mean for your innovation and discuss this internally
Don’ts
- Secondary research is never a substitute for primary research. Triangulation of methods is very important.
- Don't derive conclusions from national data on regional situations and contexts. To create valuable insights, you will need disaggregated data on your target group/region. Check with partner institutions in the area if any baselines studies, national databases or even data owned by Mobile Network Operators that can be assessed to get a differentiated image.
Potential Bias To Be Aware Of
Find a detailed overview of potential biases with counter actions here. Below a list of potential bias to be aware of when running Digital Ecosystem Analyses.

Image by Storyset from Freepik
Confirmation Bias
People tend to give more weight to evidence that confirms their assumptions and to discount data and opinions that don’t support those assumptions.
Image by Storyset from Freepik

Image by Storyset from Freepik
False Consensus Bias
False consensus is the assumption that other people will think the same way as you. May lead to assuming own logic chains and preferences guide users as well.

Image by Storyset from Freepik
Anchoring Bias
When people make decisions, they tend to rely too heavily on one piece of information a trait that already exists. A famous example is from Henry Ford: “If I had asked people what they wanted, they would have said faster horses.”
Image by Storyset from Freepik

Image by Storyset from Freepik
Sunk Cost Trap
It is very difficult for people to give up something when some resources have already been invested in it. Leads to confirmation bias.

Image by Storyset from Freepik
Implicit Bias / Stereotyping
We associate our attitudes and stereotypes to people without our conscious knowledge. Our observations and interpretations of data can be steered by that and produce biased results.
Image by Storyset from Freepik