
Guidelines
User Journey Mapping
A window into your users’ experience. Empathize with the user, align with your team, break down silos.
Image by Storyset from Freepik
Mapping Phases

Time: 1 day
Agenda Setting
- Check with product stakeholders on their questions/ use case for your User Journey

Time: 3-4 days
Internal Investigation
- Check for existing useful data
- Review or create User Persona(s)
- Synthesize internal insights and sharpen research focus

Time: 1 weeks
Qualitative Research
- User Interviews / Field Observation / Diary Studies
- Sketch main issues together with your users

Time: 1 week
Quantitative Research
- Follow up to reinforce qualitative findings, e.g. through surveys or Analytics

Time: 1-3 days if moderated , several weeks if unmoderated
Map & Operationalize
- Involve the core team in using the research results to map your user journey
- Discuss implications and next steps
Agenda Setting
1 day
- Check with product stakeholders on their questions/ use case for your User Journey
Internal Investigation
3-4 days
- Check for existing useful data
- Review or create User Persona(s)
- Synthesize internal insights and sharpen research focus
Qualitative Research
1 week
- User Interviews / Field Observation / Diary Studies
- Sketch main issues together with your users
Quantitative Research
...
- Follow up to reinforce qualitative findings, e.g. through surveys or Analytics
Map & Operationalize
1-3 days if moderated , several weeks if unmoderated
- Involve the core team in using the research results to map your user journey
- Discuss implications and next steps
Example User Journey Map

Source: NNGroup
What to do with a user journey map
This is an example of a User Journey for the User Persona Linda browsing the usa.gov page to find information on grants.
A customer or user journey consists of the following elements pictured in chronological order:
- Stages (in each stage, your user tries to achieve an important goal with your product)
- Activities your customer is taking
- Touchpoints with your product or its different interfaces
- Feelings and needs of the customer
- Improvement opportunities
In your design and development processes,
- Start brainstorming on opportunities to improve the journey for the user (usually this works better than educating him how to navigate a complicated design… ;))
- Define success criteria that will show you that your measures have actually improved the User Journey
There are more types of maps
User Research knows different mapping techniques, all aim at building a common understanding of the goals and emotions your user goes through. Here are the most common types, why you use them, what to discover, and when to use them – just click on ones of the circles to read more.
Empathy Maps
Early Discovery phase
Understanding users' mindsets by visualizing users' actions, thoughts, feelings or descriptions .
Experience Map
Late Discovery phase
A comprehensive understanding of the user experience and the general steps required for an envisioned user to accomplish a specific goal, irrespective of the product or service.
User Journey
Design phase
Understanding the steps a user takes (his/her "journey") to accomplish his or her goal with a specific product or service.
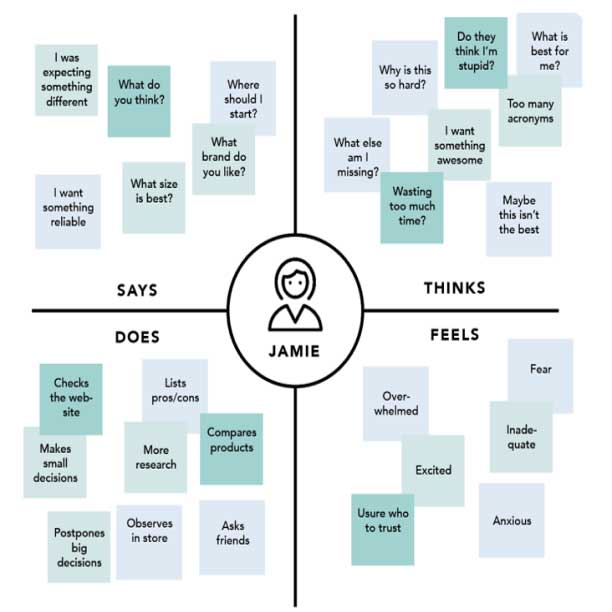
Empathy Map
Empathy maps can be used to summarize your insights into your User Persona before mapping his or her experience during using your product (Experience Map).
An Empathy Map classically consists of different sections that outline what a user
- says
- Thinks
- Does
- Feels
during a specific experience.
This is an example of an Empathy Map of a person (Jamie) buying a TV.

Source: NNGroup
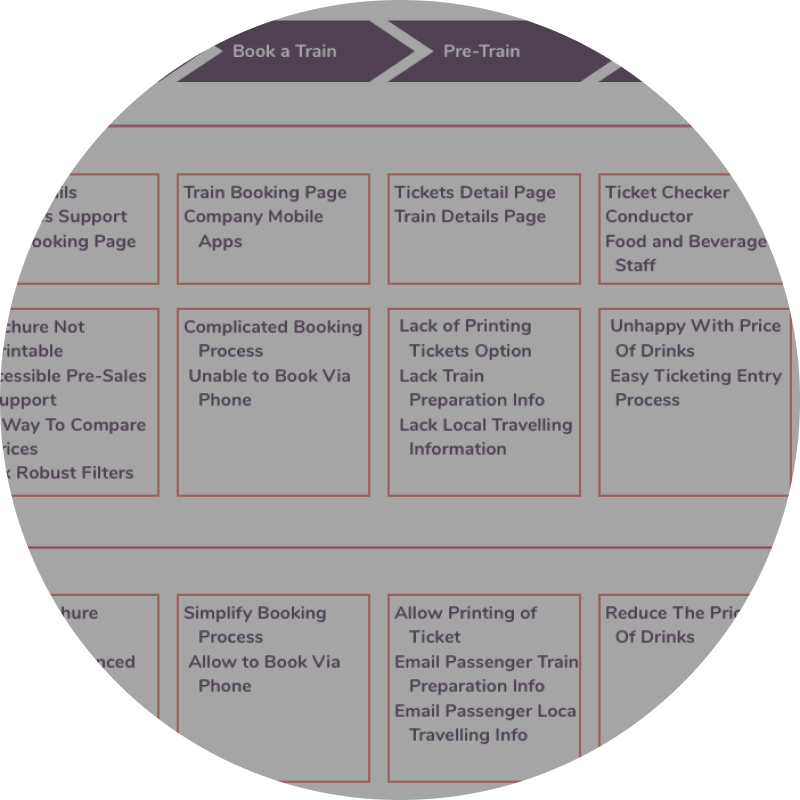
Experience Map
An Experience map usually consists of the following elements pictured in chronological order:
- Phases (in each phase, your user tries to achieve an important goal)
- Touch points with different products/ interfaces
- Thoughts and emotions of the User Persona
- Recommendations: brainstorm ideas and entry points for improvement of this experience

Source: Adobe XD
User Journey
A Customer or User Journey consists of the following elements pictured in chronological order:
- Stages (in each stage, your user tries to achieve an important goal with your product)
- Activities your customer is taking
- Touch points with your product or its different interfaces
- Feelings and needs of the customer
- Improvement opportunities

Source: Uxeria
Progression of User Mapping Methods
The more you know about your users and your innovation, the more specific your map can be.

1. Start with Empathy Maps to empathize with your user and his or her situation.
2. Use Experience Maps to map general human experiences with the existing solutions in a field.
3. Design User Journeys to understand the pain points, thoughts, touch points and steps your users take within your specific product.
Data Collection
Building Hypothesis to Prepare an Experience Map:
1. Check for existing data to sharpen the focus of your research endeavor:
- Data from prior research
- Analytics like Google Analytics / Matomo / Built-in analytic systems showing e.g. drop-off points, funnel completion rates etc.
2. Define the main touch points via qualitative research using
- User Interviews – questions to understand your users’ perceptions and emotions in a topic:
- Ask your users to map their steps/phases in your product
- What is the goal your user wants to achieve in your product in the different phases?
- What are their emotions and how do they feel as they interact with each touch point? Why?
- Is there any friction as they pass through different phases?
- How long does it take them to navigate through each phase to complete their goal?
- Field Observations– observe behavior and user context
- Diary Studies – collect longitudinal data
Qualitative data analysis for User Journeys
Interpretative methods for qualitative data analysis include:
Affinity Diagrams – method to sort insights into categories with your team to collaboratively analyze research findings as well as ideas for improvements. The main steps are:
1. Sort notes into top-level categories
2. Sort each of those categories into subcategories
3. Summarize those categories
4. Determine priorities
Digital tools for qualitative data analysis include:
Research
How to conduct quantitative and qualitative research for User Journey mapping.
Data Aggregation
Whatever method you chose to collect input data for User Journeys, focus on activities, feelings and thoughts of your users when start mapping their journey!
Things to be coded in interview transcripts or field notes:
What jobs or tasks do your users try to achieve?
What are hints to emotions with regard to your research topic?
What is your users' line of thought, what are concepts related to your reserach topic?
Simple mapping tools
- Paper – you can print out templates and get started!
- Power Point / Google Slides – work with simple shapes and add text without any graphic skills
- Miro– online whiteboard tool that offers many templates for User Journey Maps

Image by Storyset from Freepik

Image by Storyset from Freepik
Prototyping tools
- Sketch – vector-based design and prototyping tool (paid account needed)
- Adobe XD – freemium version of UXDesign tool offers templates
- Figma – free version available for people with some design skills, template for User Journey Maps offered
Image by Storyset from Freepik
User journey mapping tools:
- UXPressia – Freemium includes one template out of a huge library of User Journey models
- FlowMapp – Freemium includes access to one map

Image by Storyset from Freepik
Best Practices
Find here best practice examples with helpful tips and tricks.

Applying User Journeys to Assess Digital Inclusion for Digital Agriculture Services
Potential Bias To Be Aware Of
Find a detailed overview of potential biases with counter actions here.
Below a list of potential bias to be aware of when mapping User Journeys.
")
Image by Storyset from Freepik
Confirmation Bias
People tend to give more weight to evidence that confirms their assumptions and to discount data and opinions that don’t support those assumptions.
Image by Storyset from Freepik
")
Image by Storyset from Freepik
False-consensus Bias
False consensus is the assumption that other people will think the same way as you. May lead to assuming own logic chains and preferences guide users as well.
")
Image by Storyset from Freepik
Clustering Illusion
Many UX beginners make false clusters when they analyze data and tend to see patterns even when there aren’t any. A small sample size makes it harder to understand whether the user behavior is typical for larger user segments, increasing the risk of an incorrect assumption.
Image by Storyset from Freepik

Image by Storyset from Freepik
Implicit Bias/ Stereotyping
We associate our attitudes and stereotypes to people without our conscious knowledge. Our observations and interpretations of data can be steered by that and produce biased results.