
Guidelines
User Research Plan
The roadmap to your research. It creates alignment and buy-in among team members, helps you to stay focused and keeps the project team “on track”. Great resource to justify budgets and positions with funding agencies.
Planning User Research
When to Use Which Method?
These are the different phases your innovation design process will pass. Pick the right method for each phase to be sure to learn with and from your users at any time. Be mindful to budget for user research in all phases.
![]()
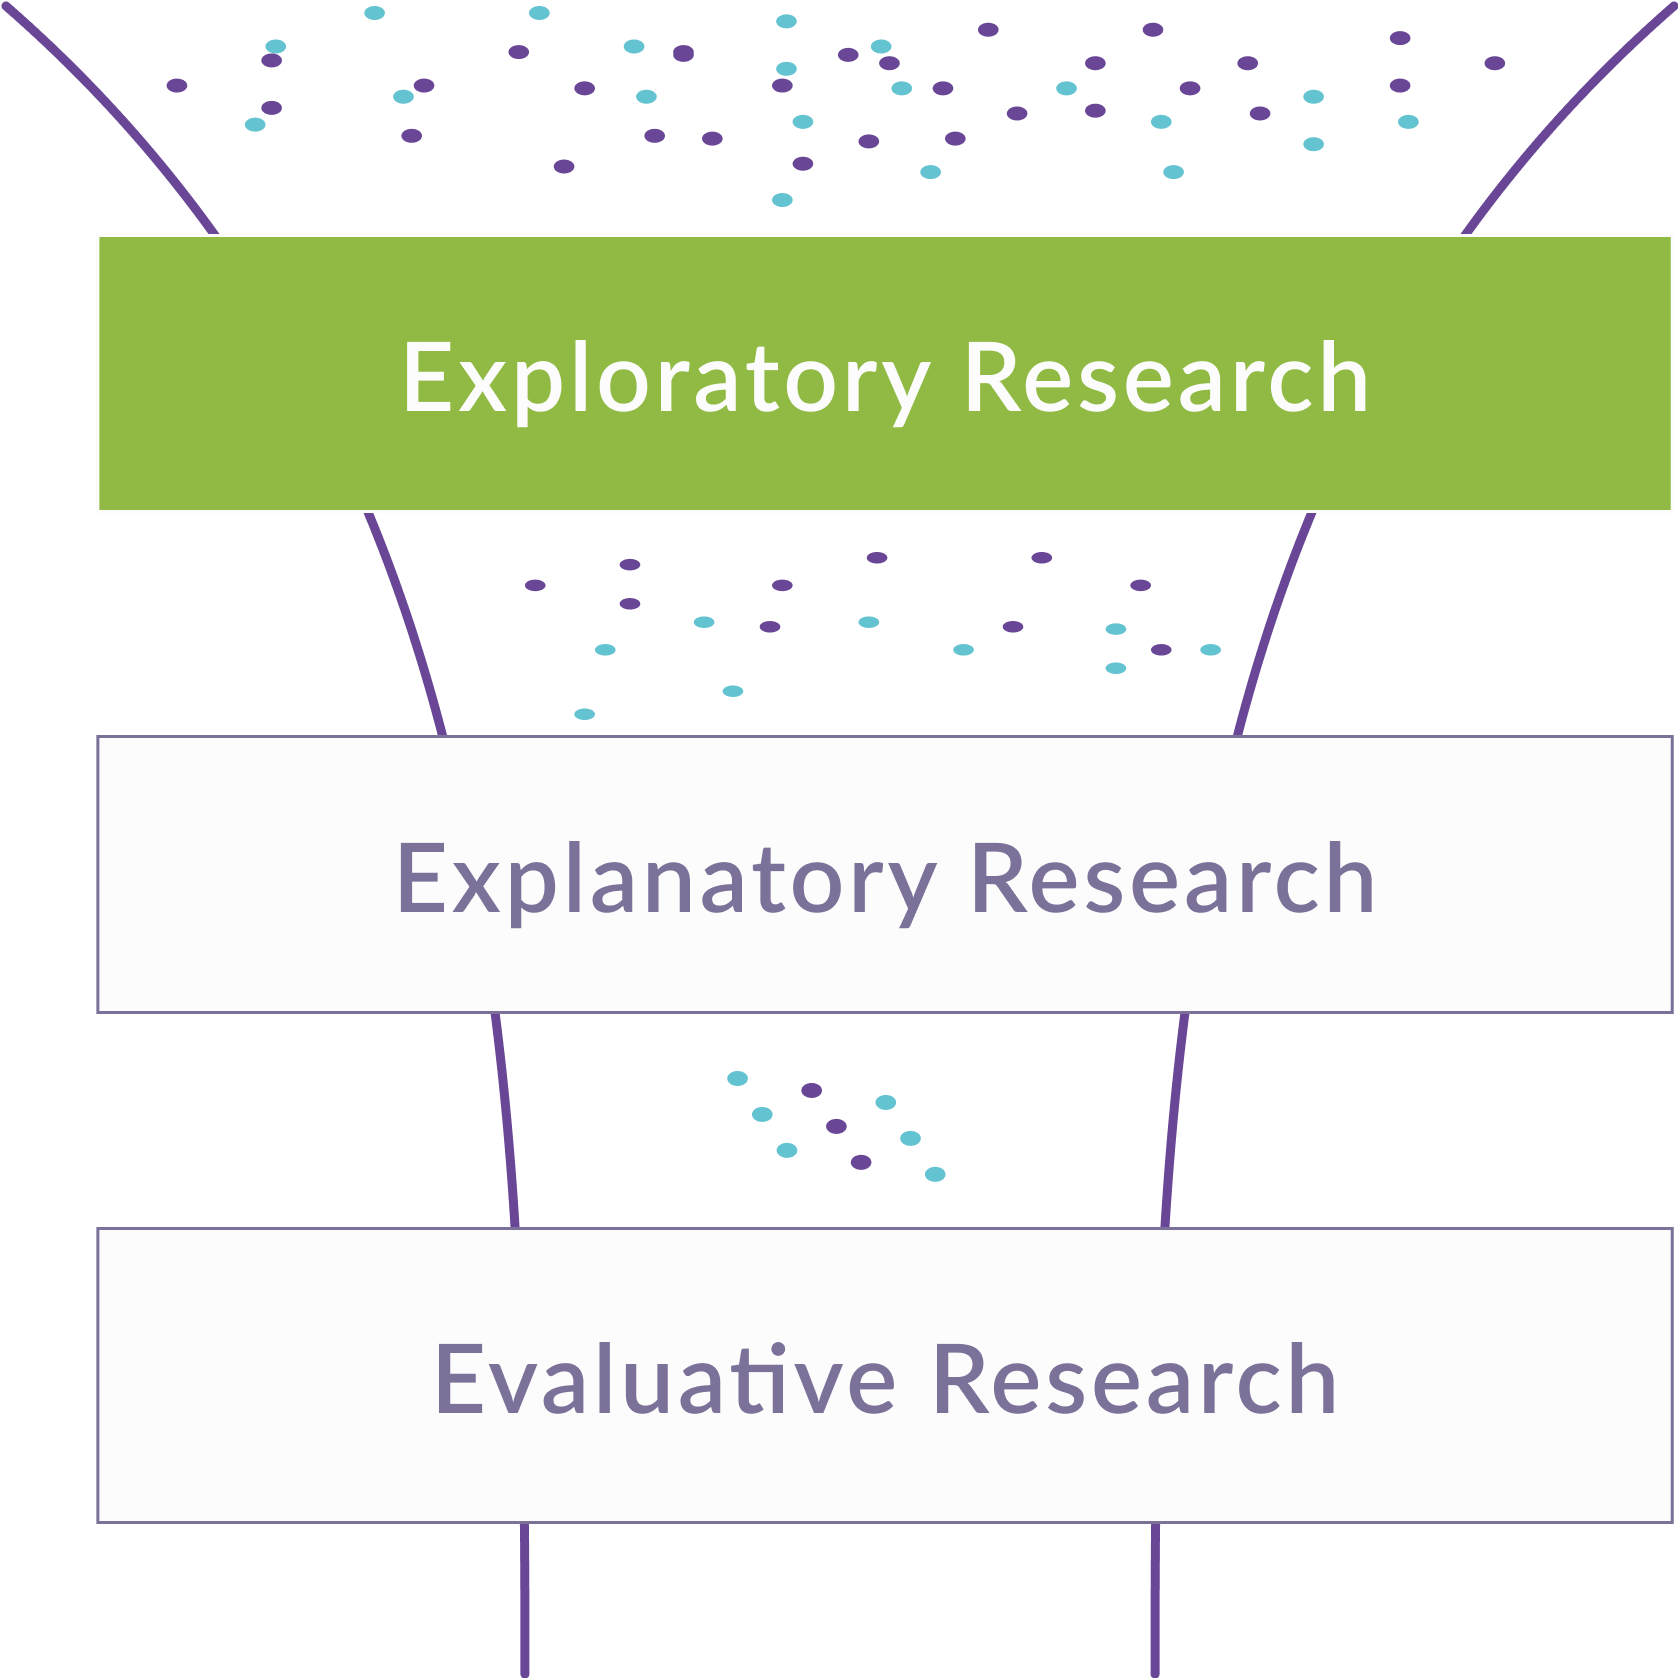
Time: Early Research
Strategize
Identifying needs and opportunities
Use these methods early in your research to identify user needs and opportunities for your innovation.
- Diary Studies
- User interviews
- User Personas
- Field Observation
- Experience Maps
![]()
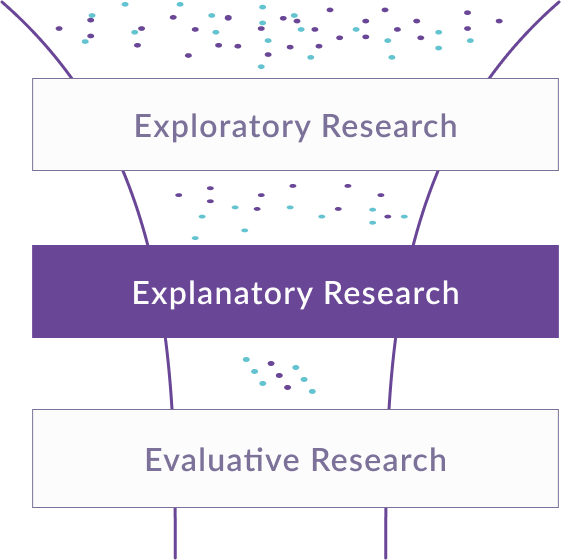
Time: Building Your Innovation
Design
When you’re starting to design an experience for your user, you can use these methods to improve usability.
- Card Sorting
- Expert interviews
- Usability Testing
- Tree Testing
- A/B Testing
- User Journeys
![]()
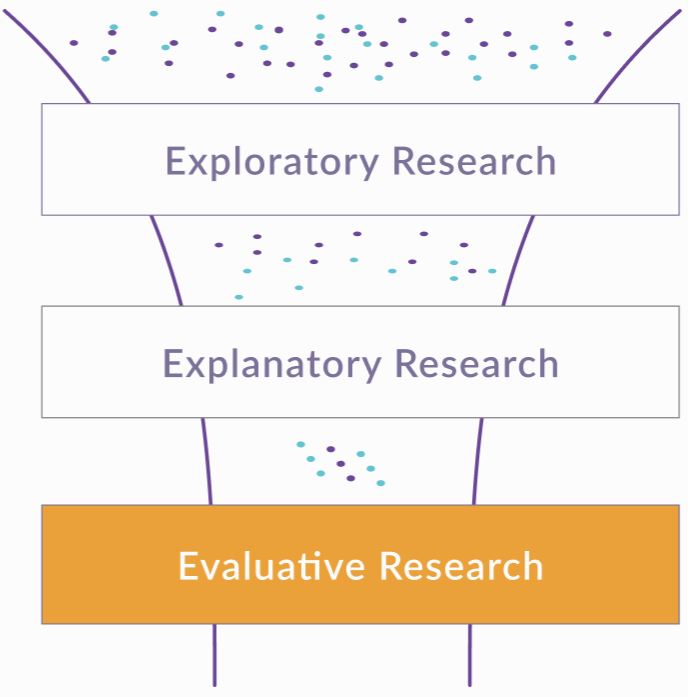
Time: Evaluative Research
Launch & Monitor
Measuring Performance
After launch, use these methods to measuring performance and iterate your design.
- Usability Testing
- Tree Testing
- A/B Testing
- Analytics
Strategize Identifying needs and opportunities
3-5 days
Use these methods early in your research to identify user needs and opportunities for your innovation.
- Diary Studies
- User interviews
- User Personas
- Field Observation
- Experience Maps
Design
1-3 days if moderated Several weeks if unmoderated
When you’re starting to design an experience for your user, you can use these methods to improve usability.
- Card Sorting
- Expert interviews
- Usability Testing
- Tree Testing
- A/B Testing
- User Journeys
Launch & Monitor
Measuring Performance
1-2 days
After launch, use these methods to measuring performance and iterate your design.
- Usability Testing
- Tree Testing
- A/B Testing
- Analytics
Data Types to Collect
Attitude vs. Behavior
- Your choice of methods should be determined by your research goal:
- Do you need to know what people think or what they do?
Attitudinal Data
- This is data on peoples’ opinions and perceptions, generated in interviews, focus group discussions or surveys, and displays what people think that they’ll do (which is not necessary what they will do in the end), how they feel when they use your product, or more generally how they understand a specific topic.
- Best collected through open questions, leaving room for honest feedback and opinions.

Image by Storyset from Freepik

Qualitative vs. Quantitative Data
- Linked to your choice on attitudinal or behavioral data is usually the decision for quantitative or qualitative data.
Qualitative Data
- Is usually collected in person ("direct")
- Is derived from interpretative analysis
- Is better suited to answer questions about why and how – questions might get adjusted during the study
- Example for methods generating qualitative data include Usability Testing, User interviews and focus groups


Comparing data collection methods
Your choice of data collection methods – e.g. a focus group or several User Interviews – should always be guided by your research question and a clear decision on which kind of data can answer this question.
Method Landscape by NNGroup
Below, you can find different research methods plotted against three dimensions to help you understand when to use which method.
- Attitude vs. Behavior
- Qualitative vs. Quantitative
- Context of Product Use
For example, A/B Testing will bring you clear results on which button or landing page is clicked on more often by your users – it is a method for assessing actual behavior and bring results as to the design of a concrete product.
Tree Testing, on the other end, will bring you insights into mental models of your users, and answer questions related to the information architecture of your service.

Source: NNGroup
How to Combine Methods
Triangulation
Triangulation is a good way to deal with the limitations that both qualitative methods (limited representativity) und quantitative methods (lack of context) bring. It will ultimately enhance the credibility of your User Research study.
Triangulation can mean using different methods to study the same problem – e.g. Field observation to understand the users’ perspective in depth, expert interviews to get an overview on related problems, and surveys to test representativity of findings (see graphic below)
Triangulation can also mean to use different metrics related to the same activity, e.g. as shown in the graphic, you can test the time a user needs for a task, his or her satisfaction, as well as potential cost models to assess the usability of a specific feature.
Examples
Other examples of method triangulation in User Research include:
- User interviews suggest a new need regarding your topic. You do a survey to assess the frequency of that need
- A quantitative Usability Test or Analytics show high drop-off rates at a specific point in your product or service. You do interviews and field observation to understand why

Source: NNG
Recruiting Participants
Depending on your choice for qualitative data or quantitative data is also the number of users you will need to interact with.
Sample Sizes for Qualitative and Quantitative Studies
For qualitative interviews or field observation rounds, you may work with a relatively small sample, while for quantitative studies you need much more users to enter the questions of “How many?” or “How long?”.
Note that qualitative and quantitative data needs to be reported differently – qualitative data cannot be used for predictions, and you should not use percentages to veil the size of your sample.

Qualitative Study
Goal:
Discover usability issues
Empathize with sample users
Explore a topic
User: 5-7
Rationale: The number of new insights drops significantly above 5.
Report:
“3 out of 5 participants in this test shared this issue”

Quantitative Study
Goal:
Measure how many people share an issue or opinion
Measure how long tasks/processes take
Predict behavior of whole target group
User: 40
Rationale: Margins of error (precision of prediction) become significantly narrower with large number of users.
Report:
“60% of users share this issue. Our margin of error is 10%.”
Best Practices
Find here best practice examples with helpful tips and tricks.
What can a User Research Plan look like? The Whiteboard Plan
This is an example of a User Research Plan for a study on fertilizer recommendations for farmers in Ethiopia using a template from Miro. It follows a standard structure:
- Problem definition (for the user and for your organization)
- Research goals and deliverables
- Research questions
- Assumptions
- Methods
- Resources needed

Source: Fertilizer Study by Alliance of Bioversity International and CIAT
Why it’s useful
![]() Very visual and modular – easy to access & update
Very visual and modular – easy to access & update
Potential challenges
![]() Might need some further explanation and context, especially for people outside the team
Might need some further explanation and context, especially for people outside the team![]() You need a (free) account to use most online whiteboards
You need a (free) account to use most online whiteboards
A more formal way to put it: The Word Document
Another way to create a User Research Plan is to write a quick overview in 1-2 pages, following e.g. this structure presented at UXDesign:
- Background
- Objectives
- Research Methods
- Research Scope & Focus Areas
- Research Participant Profiles
Why it’s useful
![]() More standardized format
More standardized format
Potential challenges
![]() Not everyone might take the time to read it
Not everyone might take the time to read it![]() More difficult to update/show progress
More difficult to update/show progress
Potential Bias To Be Aware Of
Find a detailed overview of potential biases with counter actions here.
Below a list of potential bias to be aware of when conducting User Research Plan.

Confirmation Bias
People tend to give more weight to evidence that confirms their assumptions and to discount data and opinions that don’t support those assumptions.

The Recency Effect
People tend to give more weight to their most recent experiences. They form new opinions biased towards the latest news, e.g. by focusing only on the problems found in the latest usability session

Anchoring Bias
When people make decisions, they tend to rely too heavily on one piece of information a trait that already exists. A famous example is from Henry Ford: “If I had asked people what they wanted, they would have said faster horses.”

False Consensus Bias
False consensus is the assumption that other people will think the same way as you. May lead to assuming own logic chains and preferences guide users as well.
")
Clustering Illusion
Many UX beginners make false clusters when they analyze data and tend to see patterns even when there aren’t any. A small sample size makes it harder to understand whether the user behavior is typical for larger user segments, increasing the risk of an incorrect assumption.
")
Hindsight Bias
The hindsight bias refers to people attempting to subconsciously filter memories of past events through the lens of present knowledge.

Sunk Cost Trap
It is very difficult for people to give up something when some resources have already been invested in it. Leads to confirmation bias.

Implicit Bias / Stereotyping
We associate our attitudes and stereotypes to people without our conscious knowledge. Our observations and interpretations of data can be steered by that and produce biased results.