
Guidelines
Experience Maps
Mapping phases

Time: 1 day
Scope
- Define your problem, hypotheses and questions you have
- Do this exercise with your entire team

Time: 1 week – several months
Qualitative Research
- User Interviews/ Field Observation/ Diary Studies
- Define phases of the user experience from the qualitative data
- Identify touch points between user and interface & pain points for the User Persona from the qualitative data

Time: 2 days
Map & Operationalize
- Involve the core team in using the research results to map your users’ experience (see templates at the end)
- Brainstorm on entry points for your product to improve the experience
- Prioritize next steps for your innovation development
- Do this exercise with your entire team

Time: Every 6 months
Maintain
- Review your Experience Map regularly and redo the research to understand changes
- Seek support from design experts and qualitative research experts
Scope
1 day
- Define your problem, hypotheses and questions you have
- Do this exercise with your entire team
Qualitative Research
1 week – several months
- User Interviews/ Field Observation/ Diary Studies
- Define phases of the user experience from the qualitative data
- Identify touch points between user and interface & pain points for the User Persona from the qualitative data
Map & Operationalize
2 days
- Involve the core team in using the research results to map your users’ experience (see templates at the end)
- Brainstorm on entry points for your product to improve the experience
- Prioritize next steps for your innovation development
- Do this exercise with your entire team
Maintain
Every 6 months
- Review your Experience Map regularly and redo the research to understand changes
- Seek support from design experts and qualitative research experts
Research for Experience Maps
When building Experience maps, you can either start with your hypotheses, and try to validate them in later research, or your start with a research-first approach leading up to the mapping.
Data Collection
Building Hypothesis to Prepare an Experience Map:
1. Summarize your assumptions about how a specific User Persona will solve the problem you are working on. Take a step-by-step approach and map your assumptions/hypotheses on sticky notes in the order your are assuming your User Persona will take them.
2. Take a second round of assuming what he or she will feel during the single steps.
3. Afterwards, define the most important assumptions to test regarding this map – what are crucial hypotheses to understand the experience your user has currently with the problem you wan to solve?
Methods to Prepare an Experience Map
User Interviews – understand your users’ perceptions and emotions
- What is the goal your user wants to achieve?
- What are their feelings towards the current process in place? Does it meet their expectations?
- What touchpoints and steps does the user take in each phase to achieve their goal? How do they find and interact with these necessary touchpoints?
- What are their emotions and how do they feel as they interact with each touchpoint? Why?
- Is there any friction as they pass through different phases?
- How long does it take them to navigate through each phase to complete their goal?
Expert Interviews – understand the birds-eye perspective
Field Observation – observe behavior and user contexts
Diary Studies – collect longitudinal data
Data Aggregation
After having gathered your observation and conversation notes, try to code them to understand the activities, thoughts and feelings your user go through when using your product or service.
A Qualitative Coding Approach
Interview Transcript
You work with your interview transcript and use your notes to guide you to interesting parts.

Image by Delve

Image by Delve
Categorize notes
You can use Affinity Diagramming or Thematic Analysis to cluster statements in the transcript and observations from your notes into top-level categories first, then into sub-categories. Categories could be pain points, daily activities, or motivations. Check this video by NNGroup for an example.
Image by Delve
Code notes
During coding, it is helpful to look for things related to Activities, Environments, Interactions, Objects and Users (see the AEIOU framework), but what you are looking for will heavily depend on what you aim at with your field work. E.g. if observing to gather insights for a User Journey or Experience Map, pay attention to interactions and objects.

Image by Delve
There are more types of maps
User Research knows different mapping techniques, all aim at building a common understanding of the goals and emotions your user goes through. Here are the most common types, why you use them, what to discover, and when to use them.
Empathy Maps
Early Discovery phase
Understanding users' mindsets by visualizing users' actions, thoughts, feelings or descriptions .
Experience Maps
Late Discovery phase
High-level understanding of the experience of potential users and the steps they complete when trying to achieve a particular goal across platforms or services (product agnostic) .
User Journey
Design Phase
Understanding the steps a specific user takes (his/her "journey") to accomplish his or her goal within a specific product or service .
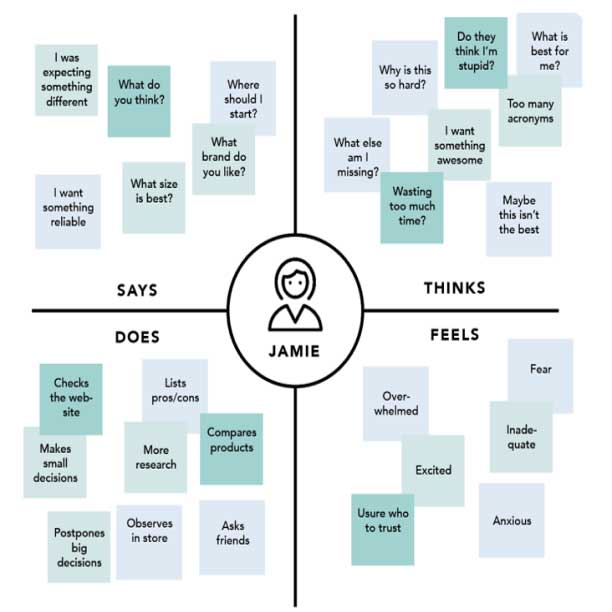
Empathy Map
Empathy maps can be used to summarize your insights into your User Persona before mapping his or her experience during using your product.
An Empathy Map classically consists of different sections that outline what a user
- says
- Thinks
- Does
- Feels
during a specific experience.
This is an example of an Empathy Map of a person (Jamie) buying a TV.

Example by NNGroup
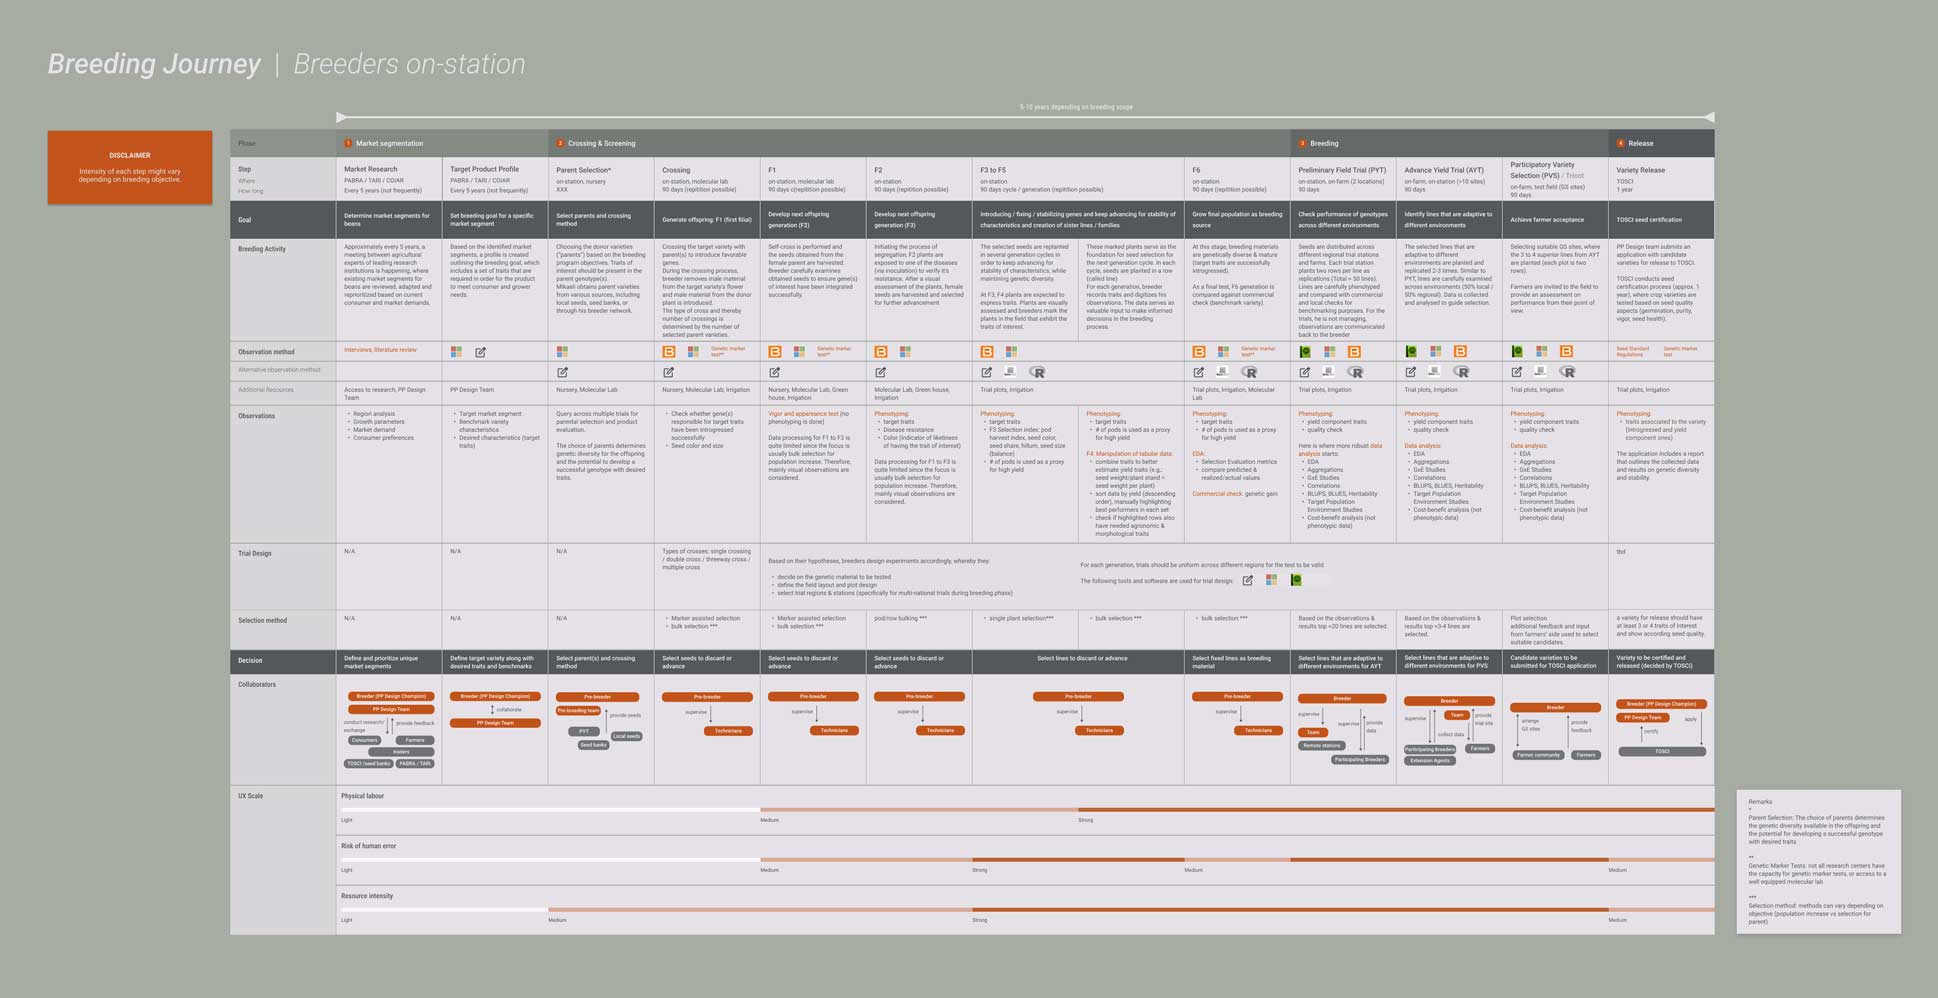
Experience Map
An Experience map usually consists of the following elements pictured in chronological order:
- Phases (in each phase, your user tries to achieve an important goal)
- Touchpoints with different products/ interfaces
- Thoughts and emotions of the User Persona
- Recommendations: brainstorm ideas and entry points for improvement of this experience

Example by Adobe XD
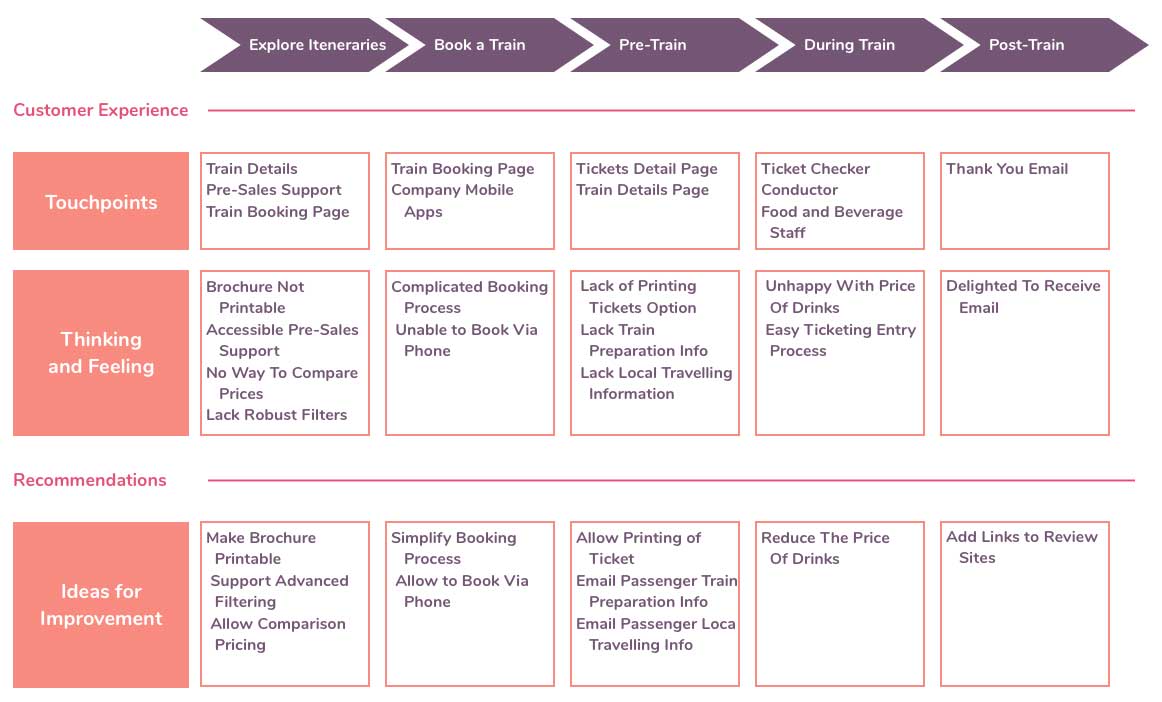
User Journey
A Customer or User Journey consists of the following elements pictured in chronological order:
- Stages (in each stage, your user tries to achieve an important goal with your product)
- Activities your customer is taking
- Touchpoints with your product or its different interfaces
- Feelings and needs of the customer
- Improvement opportunities

Example by Uxeria
Progression of User Mapping Methods
The more you know about your users and your innovation, the more specific your map can be.

1. Start with Empathy Maps to empathize with your user and his or her situation.
2. Use Experience Maps to map general human experiences with the existing solutions in a field.
3. Design User Journeys to understand the pain points, thoughts, touchpoints and steps your users take within your specific product.
Best Practices
Find here best practice examples with helpful tips and tricks.
Do’s and Don’ts
Do’s
- Involve stakeholders with instrumental knowledge and decision-making power from the start. Create multidisciplinary teams to get a wide range of perspectives on the experience
- To create an Experience map, in-person meetings are preferable to create buy-in
- Update your maps based on new experiences! It is always a good go-to point in design iterations to align and prioritize next steps
Don’ts
- Don't get lost on describing every little step. Especially if you are creating your first Experience map, try to focus on the big picture and the steps you believe matter to your user
Potential Bias To Be Aware Of
Find a detailed overview of potential biases with counter actions here.
Below a list of potential bias to be aware of when building Experience Maps.

Image by Storyset from Freepik
The Recency Effect
People tend to give more weight to their most recent experiences. They form new opinions biased towards the latest news, e.g. by focusing only on the problems found in the latest usability session
Image by Storyset from Freepik

Image by Storyset from Freepik
Anchoring Bias
When people make decisions, they tend to rely too heavily on one piece of information a trait that already exists. A famous example is from Henry Ford: “If I had asked people what they wanted, they would have said faster horses.”

Image by Storyset from Freepik
Social Desirability / Friendliness Bias
People tend to make more “socially acceptable” decisions when they are around other people. Same holds true for interviews, people want to make you feel good and will answer what they think you find pleasant and acceptable.
Image by Storyset from Freepik

Image by Storyset from Freepik
The Hawthorne Effect
The very act of being observed can cause participants to change their behavior. The quality of observational data is heavily impacted by this.