
Guidelines
Operationalize and Socialize
User Research
Use your insights from User Research in innovation development processes.
Working with User Research Results

Time: 1-2 weeks
Define Outcomes and Team
- Establish relevant goals with all affected stakeholders
- Write a good User Research Plan

Time: highly dependent on your method
Implement Research
- Collect data

Time: 2-3 days
Prepare Results
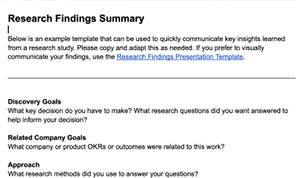
- Report with enough detail and context for outsiders to understand your research findings
- Provide actionable design recommendations

Time: 1 day (you might need to repeat this for different stakeholders)
Communicate Results
- A good presentation of results includes context, insights and feedback

Time: 1-2 days
Plan Next Steps
- Prioritize the issues to solve by impact, frequency and effort needed to fix them
- Distribute responsibilities in addressing the issues
- Create a regular user feedback structure for the implemented design changes
Define Outcomes and Team
1-2 weeks
- Establish relevant goals with all affected stakeholders
- Write a good User Research Plan
Implement Research
highly dependent on your method
- Collect data
Prepare Results
2-3 Days
- Report with enough detail and context for outsiders to understand your research findings
- Provide actionable design recommendations
Communicate Results
1 day (you might need to repeat this for different stakeholders)
- A good presentation of results includes context, insights and feedback
Plan Next Steps
1-2 days
- Prioritize the issues to solve by impact, frequency and effort needed to fix them
- Distribute responsibilities in addressing the issues
- Create a regular user feedback structure for the implemented design changes

Graphic by Salomé Keller
Structures & Capacities
Working efficiently with User Research results is not only a question of the right tools and techniques – it is also linked to your working structures and team capacities! Here are two recommendations on how to work towards being more responsive to user needs and behavior:
Human-Centered Design Approach
Adopting a Human-Centered Design (HCD) approach can help you to create user-centric decision-making procedures in your team: when do you take decisions, based on which data, and who is part of the decision?
These are important questions to solve when following the Human-Centered Design process. Below you find a graphic showing the steps of an ideal HCD process. At the beginning of your innovation design, try to reserve some time to plan and define your steps within this process.

Research Ops
Filling the position (or role) of a ResearchOp avoids the reliance of your research’s effectiveness on the personal charisma of an individual researcher. ResearchOps work on research operations, which means they orchestrate and optimize the cooperation of people, processes, and methods to amplify the value and impact of research at scale. They aim at supporting researchers in planning, conducting, and applying quality user research
Common focus areas of Research Ops are:
- Participants: Recruiting, screening, scheduling, and compensating participants
- Governance: Processes and guidelines for consent, privacy, and information storage
- Knowledge: Processes and platforms for collecting, synthesizing, and sharing research insights
- Tools: Enabling efficiencies in research through consistent toolsets and platforms
- Competency: Enabling, educating, and onboarding others to perform research activities
- Advocacy: Defining, sharing, and socializing the value of user research throughout the organization

Documenting User Research
There are various ways to document and present your research results. Start with what feels most adequate, you do not have to start with the full report! Feedback on less formalized presentations will help sharpen your focus.
Source: userinterviews
Collaborative Docs
Collaborative Docs (e.g. a Google Doc or shared file on MS Teams) are a good way to involve several researchers and create a living document while discovering a topic, brainstorming and collecting thoughts on what results could mean.
Source: uxtweak
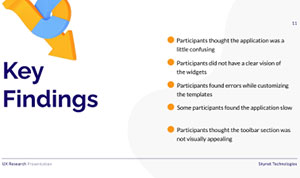
Slides
Slides can help to visualize some key findings and illustrations (quotes, videos or shots from testing sessions). You can find many ppt templates for User research presentations at the end of this module.
Source: uxtweak
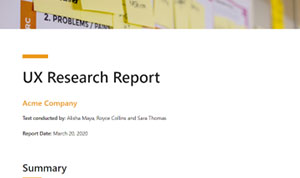
Whitepapers and Reports
Whitepapers and reports summarize insights, give context to the research and point at ways forward.
Range of Documentation Formats

The User Research Report
A research report concludes your research’s findings and is understandable to outsiders or future team members.
Key questions people will look for in your report are:
- What is this about?
Overview of the study and its initial objectives - What were we looking for?
Research questions and related decisions - Why did we investigate this?
What do you aim to achieve as an organization or team? - How did we do it?
Methods and justification for your choice - What did we learn?
Key learnings - What now?
Actionable recommendations and further research recommendations
You can use the checklist from userinterviews to verify if you have included all necessary information.

Source: userinterviews
Prioritize Next Steps
Once you have your results and your team agrees on them, it’s crucial to incorporate them into your decision-making to improve user focus and boost adoption.
1. Prioritize Findings
The most common matrix to use is an impact-effort matrix, but there are many ways to understand what is your best next step – you can score the issues based on the HCD aspects of feasibility, desirability and viability, or with a view to your different User Personas as must-haves or nice-to-haves. Check out the article by NNGroup for an overview on different options.
Involve your team to vote based on your understanding of the research findings!
An easy method is dot voting.

2. Plan for Validation of Findings
If you have started with a qualitative study (best practice in early design phases), you can quantify your findings, e.g. via a survey to understand how many users share the identified issue.
3. Ideate Based on Research
User Research will bring you insights on the status quo, and past experiences your users made. Now it’s your turn to be creative in designing solutions! Try using How might we’s and other brainstorming techniques to start designing low fidelity prototypes to adress the needs and pain points you identified. If your innovation is already designed, try setting up A/B tests to pilot ideas for changes in your current design.

Source: NNGroup
4. Define Success Criteria
Every change you make should be based on assumptions you draw from your existing User Research data. Follow up on this and evaluate whether the changes are actually addressing your prioritized pain point. Don’t expect one round of research to bring you definite and final results on your users’ behavior and preferences. Every new prototype or version is a chance to learn and improve!
Best Practices
Find here Do’s and Don’ts to Operationalize and Socialize your research findings.
Do’s and Don’ts
Do’s
- Before starting your research, engage the whole team to clarify what they would want to learn from your User Research and what are the problems they are trying to solve
- It is important to acknowledge that user preferences and needs are not the only defining aspects in a design process.
- Business/Organizational objectives tend to overwrite user research results if not strategically integrated from the start. So don't start research on a design option that does contradict key business/organizational goals.
- Tailor your findings to the needs and interests of your audience! Designers and developers might be interested in different aspects than the project management.
- Whenever possible try to substitute text with graphs, images or screenshots to make your report more interesting and clearer. User quotes or videos from testing sessions can be very convincing, too.
- Always be transparent about your methods (including their limitations) and be ready to back your insights with metrics – e.g. how many users experience the key issue you are presenting. Key metrics of usability tests include success rates, average time to complete tasks, error rates and satisfaction rates.
Don’ts
- Don't rely on single researchers to be the memory of your research and the insights gained. Human memory might be flawed, and researchers move on to the next project. That is why a clear documentation is so important.
- Don't overwhelm your design team with raw data in your report. Summarize your learnings to find key insights and present those. This might include discarding some of your data if its unhelpful to answering your initial questions.
- Instead of solely concentrating on the areas that need improvement, it's important to acknowledge the positive attributes of your product or service as well. Highlighting these positive features can be a source of inspiration for your audience, so don't overlook them.
- You shouldn't solely depend on your report to convey your message. Not everyone will read it and information might get lost or misinterpreted. Always try to present in person.